Headlines vs. The Full Story
- Nov 25, 2022
- 6 min read
Headlines vs. The Full Story takes a look at trending headlines that focus on Canada, geographic regions, the Atlantic region, and the province of Newfoundland and Labrador. Keep reading to learn more about how population and immigration stories change as the level of geographies change.
INTRODUCTION
This write-up discusses how the 2021 Census data provides context for understanding trending headlines. Below you will find presentation slides and a write-up that explains the content in the slides.
Outline:
KEY GEOGRAPHY TERMS
Geography and data go hand-in-hand. All population data is associated with a specific geographic area.


For more information about the geographic hierarchy, check out our Data to Decisions section on Data by Geographical Areas.
Definition of Immigrants
'Immigrants' includes persons who are, or who have ever been, landed immigrants or permanent residents. Such persons have been granted the right to live in Canada permanently by immigration authorities. Immigrants who have obtained Canadian citizenship by naturalization are included in this category. In the 2021 Census of Population, 'Immigrants' includes immigrants who were admitted to Canada on or prior to May 11, 2021 (Source: Statistics Canada).
"Immigrants" does not include non-permanent residents such as temporary foreign workers or refugees
For simplicity, immigrants are often called "New Canadians."
CANADA
POPULATION
Let's start with a trending headline that captures the country as whole.

The headline above highlights that Canada has experienced a high rate of population growth that is largely due to immigration. This claim is based on data from the most recent Statistics Canada population census.
Although the headline above indicates a trend going back to 1957, this discussion will only include data from the 2016 census and the 2021 census, thus covering a five year time period.
To understand the data behind this headline, we must first look at population data for Canada.
Population of Canada
2016 | 2021 |
35,151,728 | 36,991,981 |
From this data we know that the population of Canada increased by approximately 5% from 2016-2021.

IMMIGRATION
Now let's look at the number of immigrants living in Canada for the same time period, 2016-2021. This data is also from the 2021 population census.
Immigrants in Canada
2016 | 2021 |
7,540,825 | 8,361,505 |
From this data we know that the number of immigrants living in Canada increased by approximately 11% from 2016-2021.

Immigrants in Canada represent a small proportion of the total population, however, immigrants have significantly contributed to overall population growth in the last five years.
This is the foundation of Canada's population and immigration data story. Now let's bring the story down a level to discuss the variations between Canada's geographic regions.
GEOGRAPHIC REGIONS

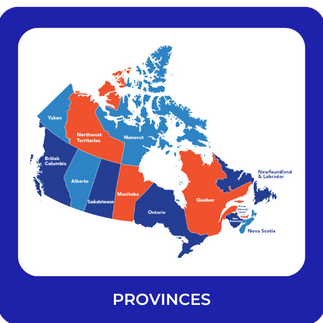
Canada is divided into six geographic regions: Territories, British Columbia, Prairies, Ontario, Quebec, and Atlantic. As you can see on the map above, some regions contain multiple provinces or territories and some geographic regions are provinces on their own.
POPULATION
Canada's population is distributed unevenly across these geographic regions, as shown in the pie chart below.

Recall from earlier that Canada's population growth rate for 2016-2021 is approximately 5%. Similar to the uneven population distribution across Canada's geographic regions, the rate of population growth also varies across the geographic regions. Take a look at the map below.

This breakdown by geographic region shows how different areas are experiencing different magnitudes of population growth. An overall population growth of 5% for Canada is true, but it does not mean that each region grew by 5%.
We must also consider how the distribution of population affects our interpretation of growth rates. For example, Quebec and the Territories have the same growth rate, 4%. However, when we consider how many additional people made up this growth we start to see bigger differences; Quebec had an increase of 337,472 people whilst the Territories had an increase of 4,556 people.
IMMIGRATION


Above are two trending headlines that were found when searching for articles about Atlantic Canada's population. Both indicate that immigration in the Atlantic region had a high growth rate.
To understand the data behind these headlines, let's take a look at the immigration growth rates for each geographic region to see how the Atlantic region compares.

As the bar chart above shows, the Atlantic region had the highest immigration growth rate. Although this is true, we need to be careful that we interpret the data correctly. The highest growth rate does not necessarily mean that the Atlantic region has the highest number of immigrants. See the pie chart below.

It is also important not to downplay significant immigration growth rate just because the overall number of immigrants in comparison to other regions is low. However, this data is needed to understand the full context.
Now let's bring the story down a level, once again, to discuss the variation between the Atlantic provinces.
ATLANTIC CANADA

Atlantic Canada is made up of four provinces: New Brunswick, Prince Edward Island, Nova Scotia, and Newfoundland and Labrador.
POPULATION
Atlantic Canada's population is distributed unevenly across these provinces, as shown in the pie chart below.

The growth rates for each of the Atlantic provinces are also different.

As you can see from the map above, the province of Newfoundland and Labrador has a negative growth rate, meaning that the population decreased. This data explains the headline below.

The importance of local context is becoming more clear. Had we taken the Atlantic population growth rate of 3.3% and assumed it applied to each province within the region, we would have misinterpreted Newfoundland and Labrador's story. An overall population increase and an overall population decrease are addressed very differently so it's important that the resolution of data used aligns with the geographic resolution you are examining.
IMMIGRATION

In addition to an overall population decline, the headline above highlights that Newfoundland and Labrador had the lowest rate of immigration in the Atlantic region. This data is shown in the bar chart below.

As previously mentioned, immigration growth rates and distribution of immigration must be carefully interpreted. One does not necessarily predict the other.

Now that we've explored population and immigration data in the Atlantic region, let's take a closer look at Newfoundland and Labrador.
NEWFOUNDLAND AND LABRADOR

The map above indicates the locations of Census Metropolitan Areas and Census Agglomerations, large population centers.
Census Metropolitan Area (CMA)
A Census Metropolitan Area (CMA) is an area that has a population of over 100,000 people with at least 50,000 residing in the core. St. John's is the only CMA in Newfoundland and Labrador.
To learn more about CMAs, check out Data to Decisions: Data by Geographical Areas.
Census Agglomeration
A Census Agglomeration (CA) is an area that has a population of over 100,000 people with at least 10,000 residing in the core. Corner Brook, Grand Falls-Windsor, and Gander are CAs.
To learn more about CAs, check out Data to Decisions: Data by Geographical Areas.
POPULATION
Take a look at the pie chart below to see how Newfoundland and Labrador's population is distributed across the province.

Recall that the last two headlines we discussed highlighted Newfoundland and Labrador's overall population decrease and that it had the lowest rate of immigration of the Atlantic provinces. We found another headline that indicated there are also differences in population growth within the province.

To understand the data behind this headline, we need to look at population growth rates across the province.

From this data we can see that although the overall population of Newfoundland and Labrador decreased, the St. John's CMA and the Gander CA both had an increase in population from 2016-2021. The two other CAs, Corner Brook and Grand Falls-Windsor, and the rest of communities combined decreased in population size.
The "Rest of NL" category is the average growth rate across all communities in NL that are not a part of a CMA or CA. Since this is an average of multiple towns, it is likely that at a higher resolution, the data would show that different areas have different growth rates. Despite the overall population decline for the "Rest of NL" it is possible that some communities grew.
IMMIGRATION
The 2021 Census data also provides immigration data for Newfoundland and Labrador. Since population decline is a challenge for the province, immigration is important to consider as it helps to increase population. Let's take a look at what the data tells us.

As you can see above, the majority of immigrants in Newfoundland and Labrador are in St. John's. The bar chart below shows that Gander's immigration growth rate is 40%, much higher than the provincial average of 18%. This is encouraging as it shows an improvement of immigration outside of the St. John's CMA. However, we still need to consider the total number of immigrants in Gander is 300 -- a small proportion of the total immigrants in Newfoundland and Labrador.

CONCLUSION
Using these examples of population and immigration data, starting at the national level and working our way down to a community level, we saw how data and geography is the key to understanding the context behind trending headlines.
We seen how numbers and rates vary greatly from region to region, province to province, and community to community. These variations are important to consider for decision-making and policy development.
The Regional Analytics Laboratory (RAnLab) specializes in managing and analyzing local level data. For example, the "Rest of NL" category above can be further divided to understand local nuance. Click here to learn more about RAnLab's local data expertise.
Interested in learning how to use data on your own? Check out our Data to Decisions series that teaches about the geographic hierarchy, collecting and using data from Statistics Canada, and more!